A round of applause is in order because Nav Creative recently celebrated an incredible milestone!…
How to use an infographic to promote your business
Images alone are eye-catching and easy to understand at a glance, but they often lack information. Words offer more detail, but are more time-consuming to process. Enter: the infographic! In a TMI world, infographics are the beautiful, bite-sized chunks of information that almost everyone still has time to digest. They combine the strengths of both words and graphics to communicate in a powerful way with just about any audience—and that’s why you should use infographics to support your business. Here’s how to do it.
Infographics: the basics
—
Infographics are most commonly used to provide a summary of a lot of data in a compact space, and can also help characterize the data. For example, they can show how information is distributed in different geographical areas. They can also illustrate a timeline effectively, or depict a “how-to,” an anatomical breakdown, or flow chart with ease. Infographics can provide a visual comparison of products, services, or ideas, and can also depict hierarchical ideas such as how businesses or schools rank. Finally, infographics are ideal for lists and reports, because they make things that are typically dull (like CVs, earnings reports and product lists) a lot more interesting.
Why are infographics so effective, you ask? The brain receives 90 percent of its information visually. Humans are hard-wired to remember images. We only remember about 10 percent of information we hear after only three days—unless it comes with images. Information with pictures gets remembered 65 percent of the time. No surprise there, since 65 percent of us are visual learners.
Beyond these basic facts, research has already proven that infographics increase web traffic. Social media posts with images also garner more engagement: 650 percent more. And according to marketers, infographics are among the most engaging types of visual content.
Infographics and small businesses
—
Infographics are particularly useful for small businesses. They are an excellent tool for improving brand awareness, increasing traffic to your website and optimizing it for search. Infographics are also a prime vehicle for establishing thought leadership, since they allow you to show off a depth and breadth of knowledge in a small space.
Small businesses spend a lot of time communicating their brand’s story, and infographics get that job done more effectively and memorably. They offer the small business more bang for its buck, because you only have to create the infographic once, but you can use it many times. Share it via email, across multiple social media platforms, in your affiliate marketing information, in your media kits, on your website and anywhere else you choose.
Finally, infographics last. They have a long shelf life, and if you choose the right topics, they remain relevant and shareable for months or even years—the perfect format for evergreen content.
Striking, successful infographics
—
Here are some of our favorite small business infographics, with a few words about why they work.
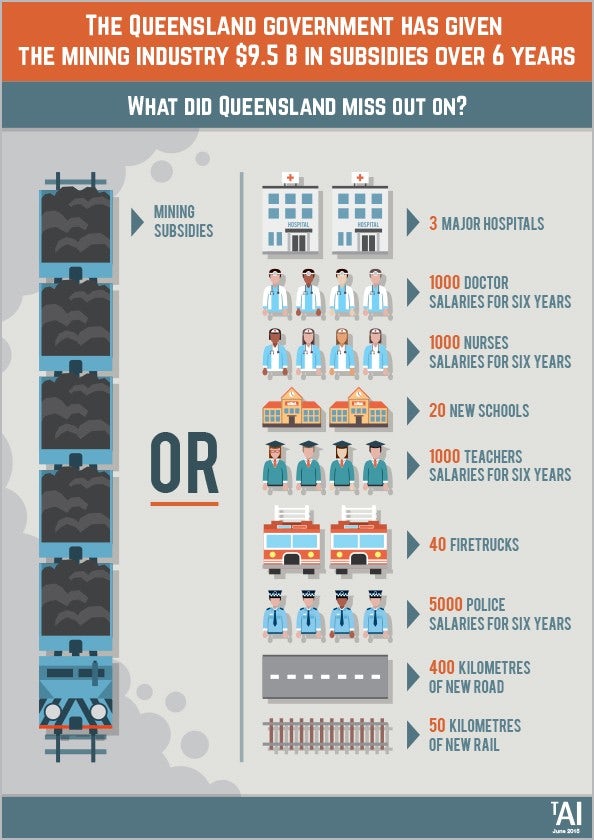
Compare things
If you have different services, products, or other things you want to compare, infographics are the perfect way to do it. Here is an example of a comparison infographic that shows how much money was spent on mining subsidies in Queensland, Australia—and how else it might have been spent.
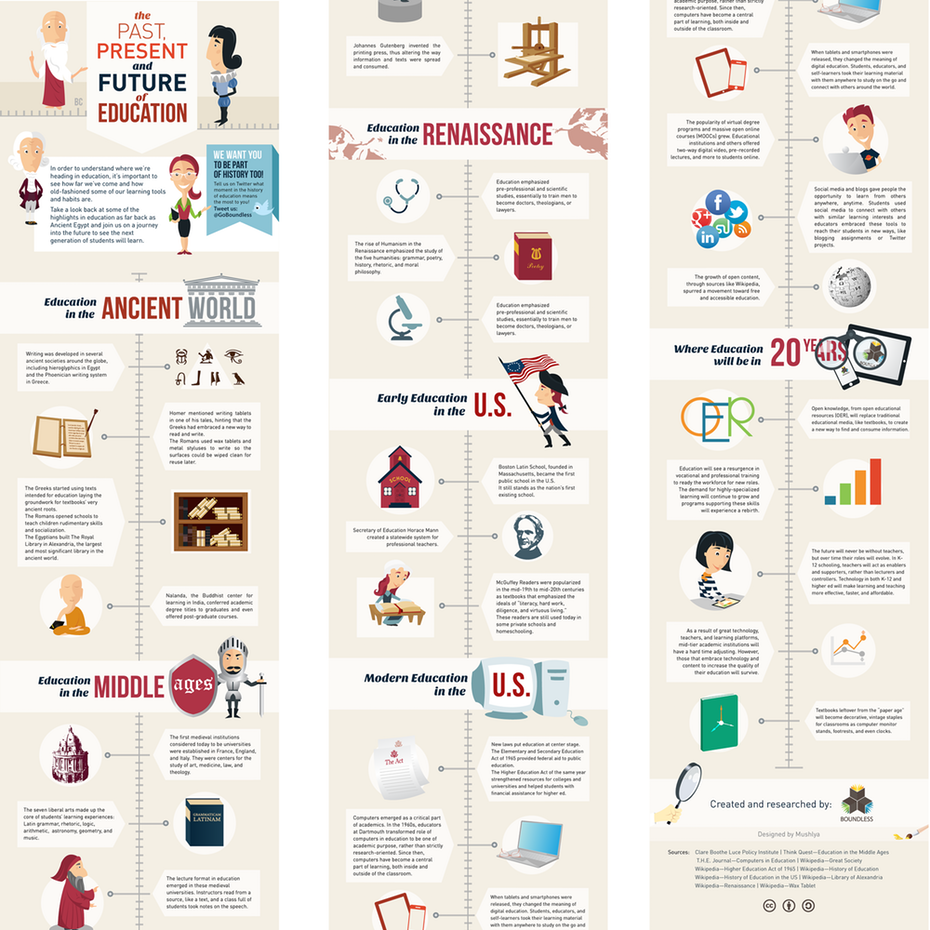
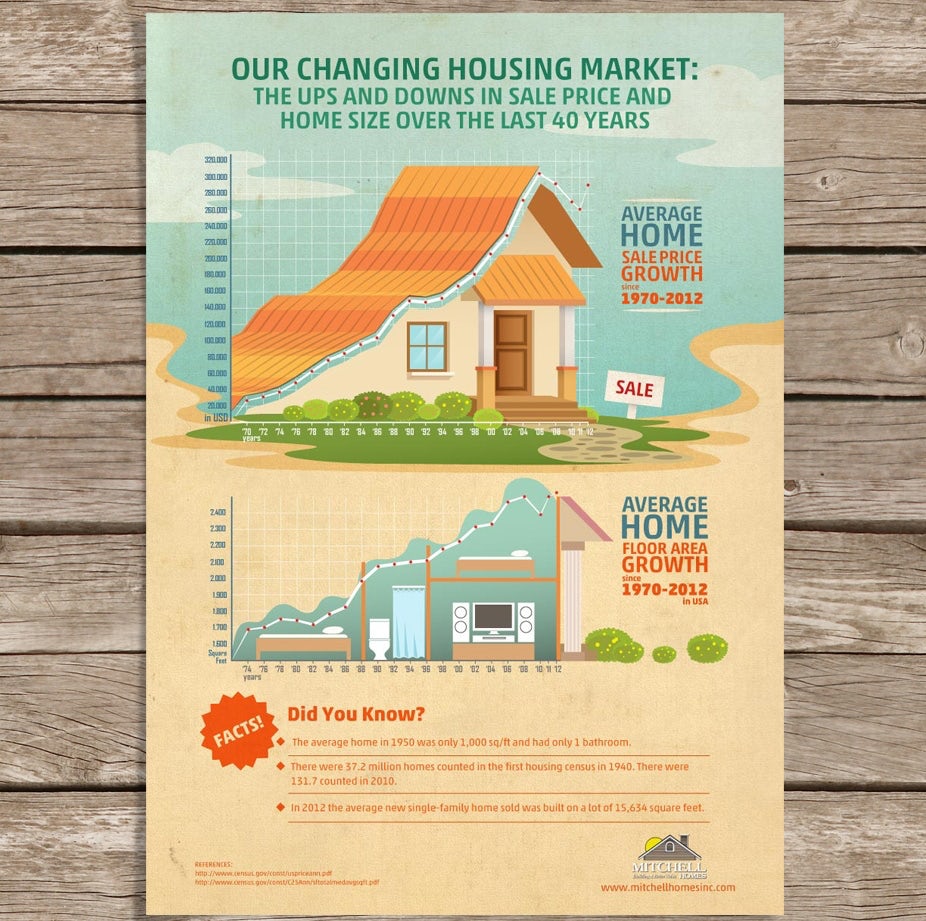
Create a timeline
Use an infographic to show the timeline of anything—from the story of your business to the history of education—as the designer has done in this example.
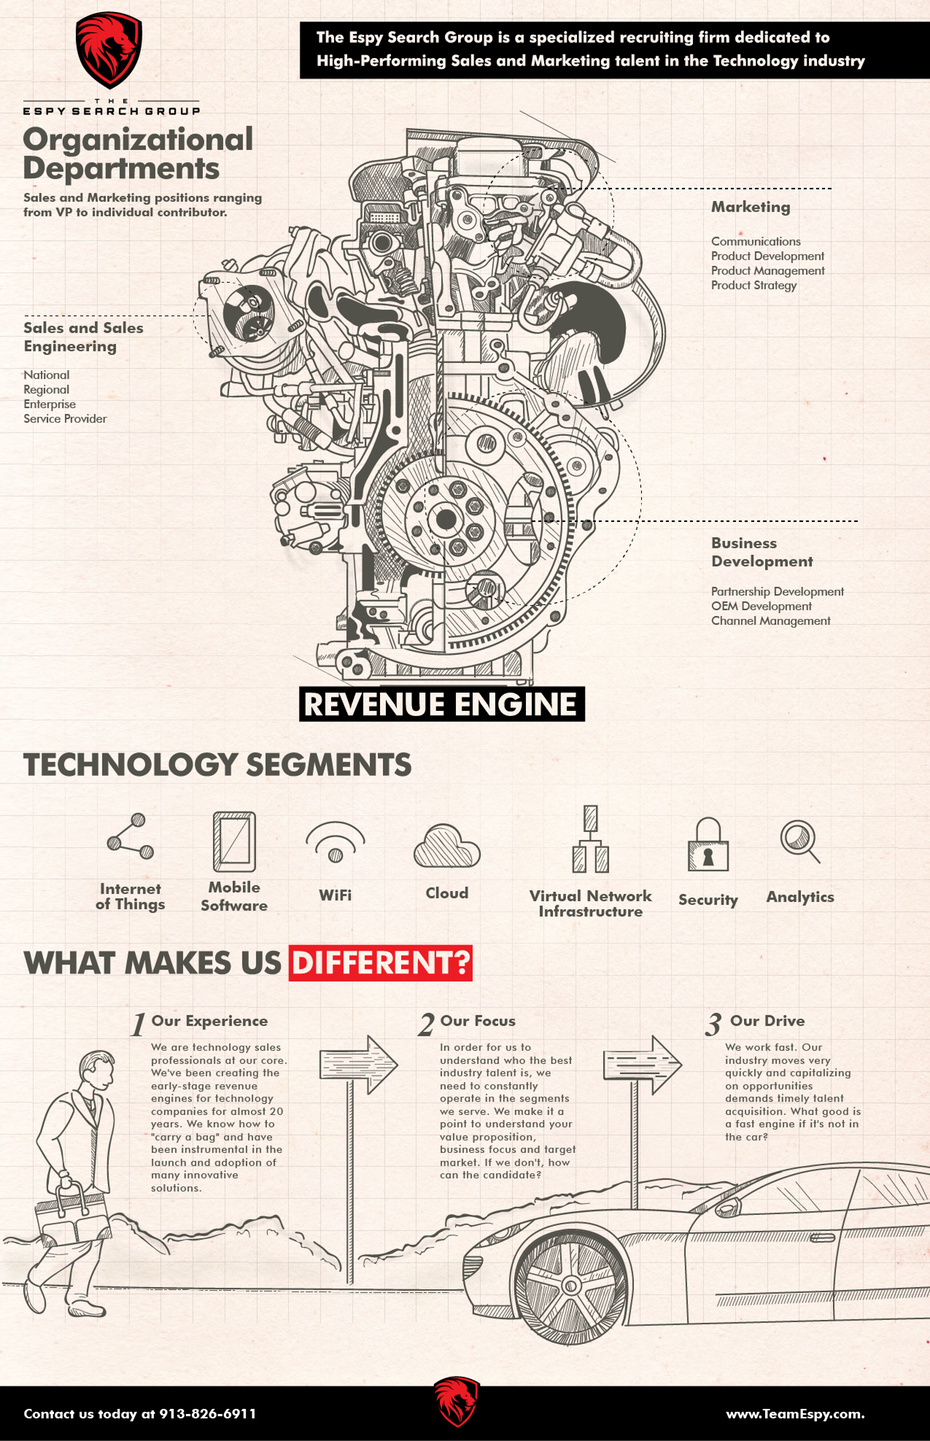
PR materials
Infographics are great for your PR kit, and you can use them in a number of ways. In this example, you can see what initially looks like a diagram of an engine, but it’s really a metaphor for the business itself.
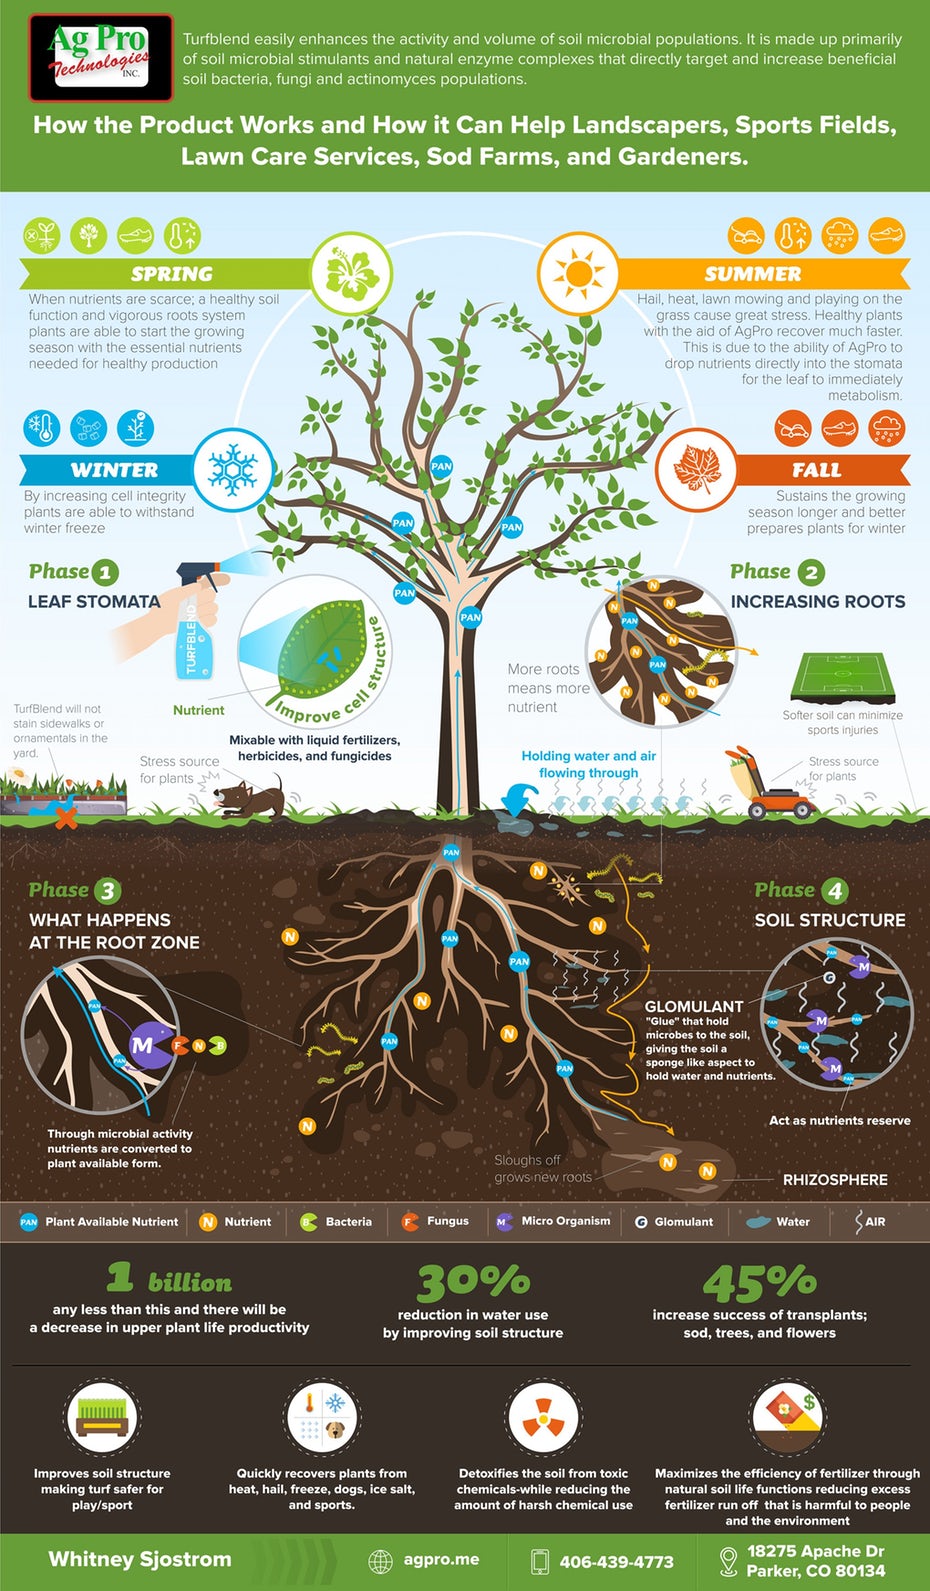
How-tos
For complex concepts like “how-to” guides and detailed explanations of services, infographics are one of the best possible tools. You can present everything from pain points to solutions visually, and keep your audience engaged.
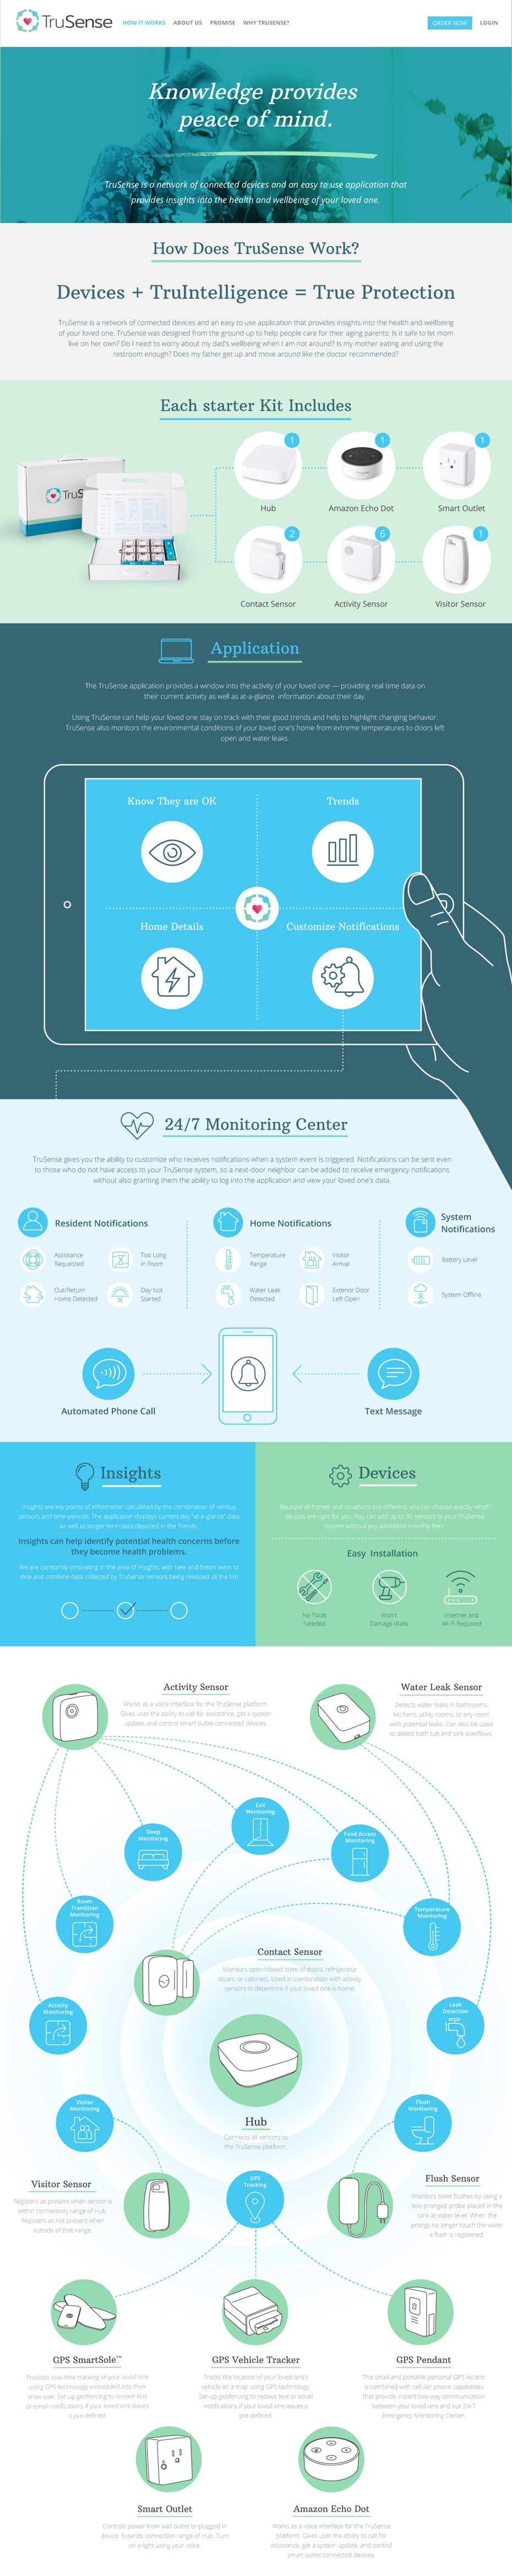
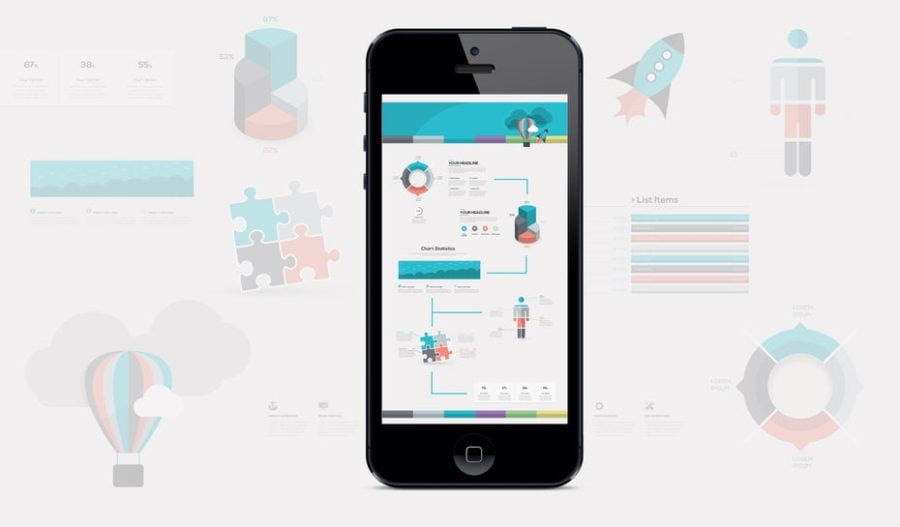
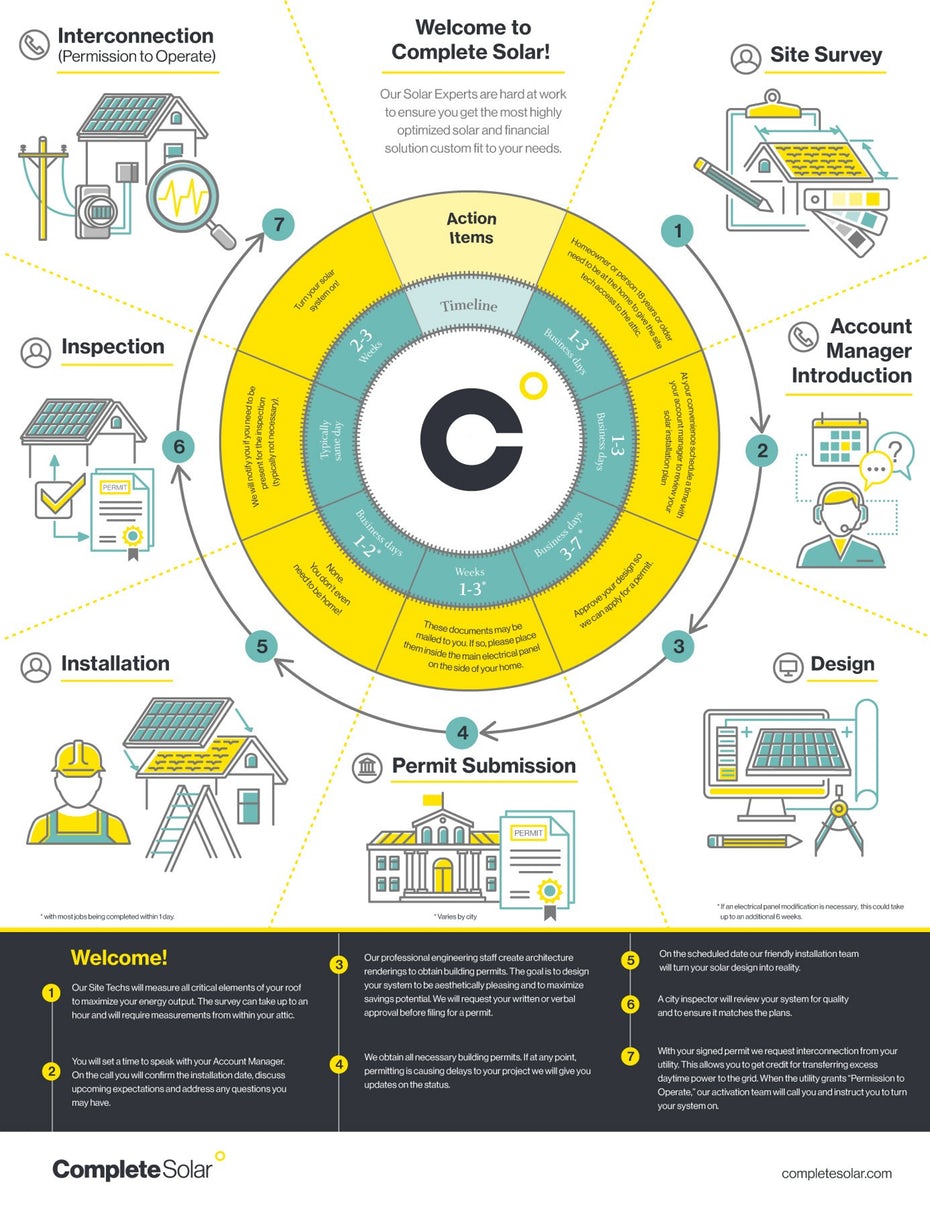
Product or service showcase
Showcase your product line or service with an infographic that systematically breaks it down, feature by feature. In this example, note the details on time, and the order of the steps people using the service need to take.
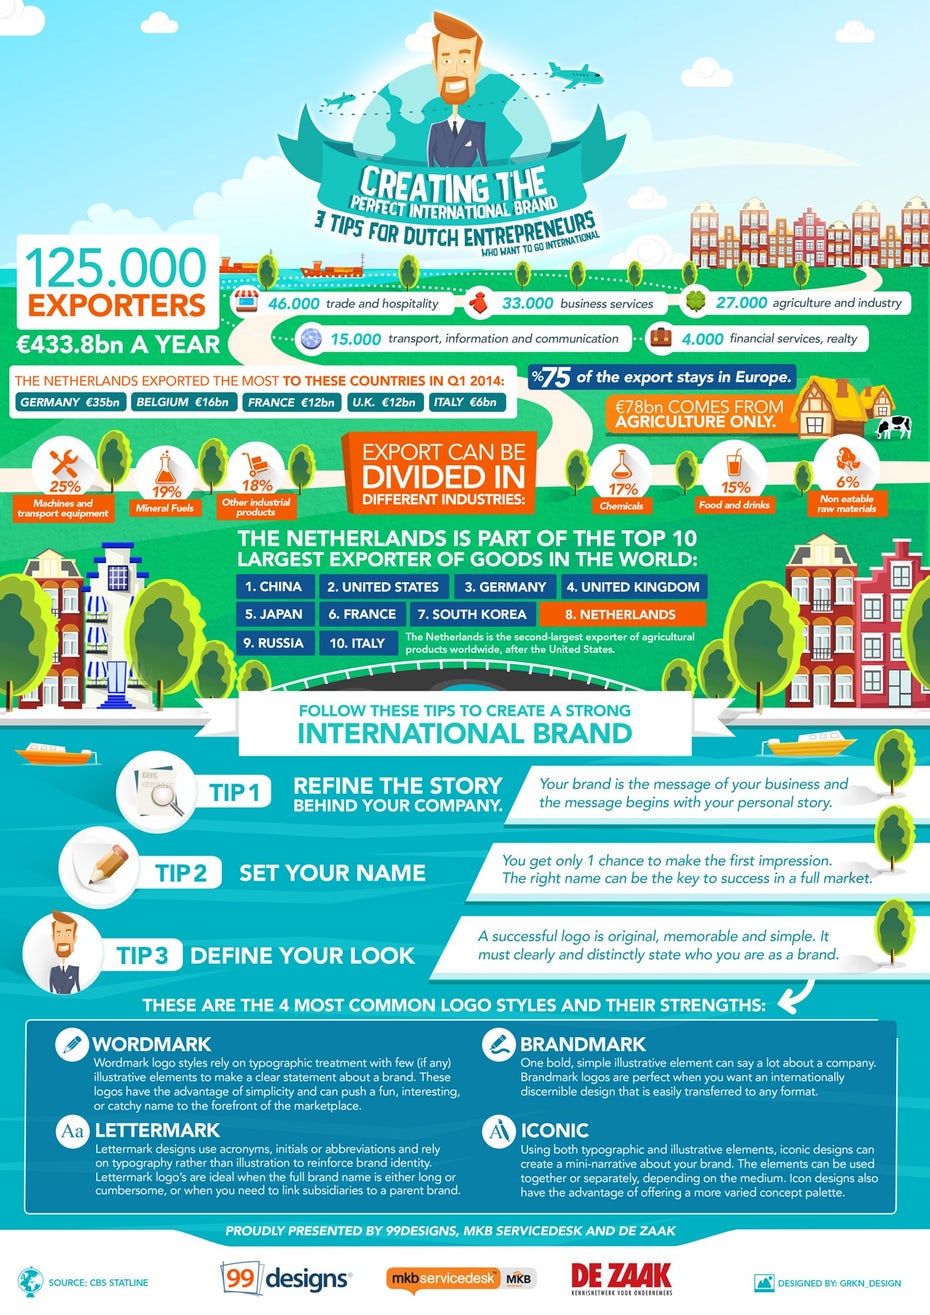
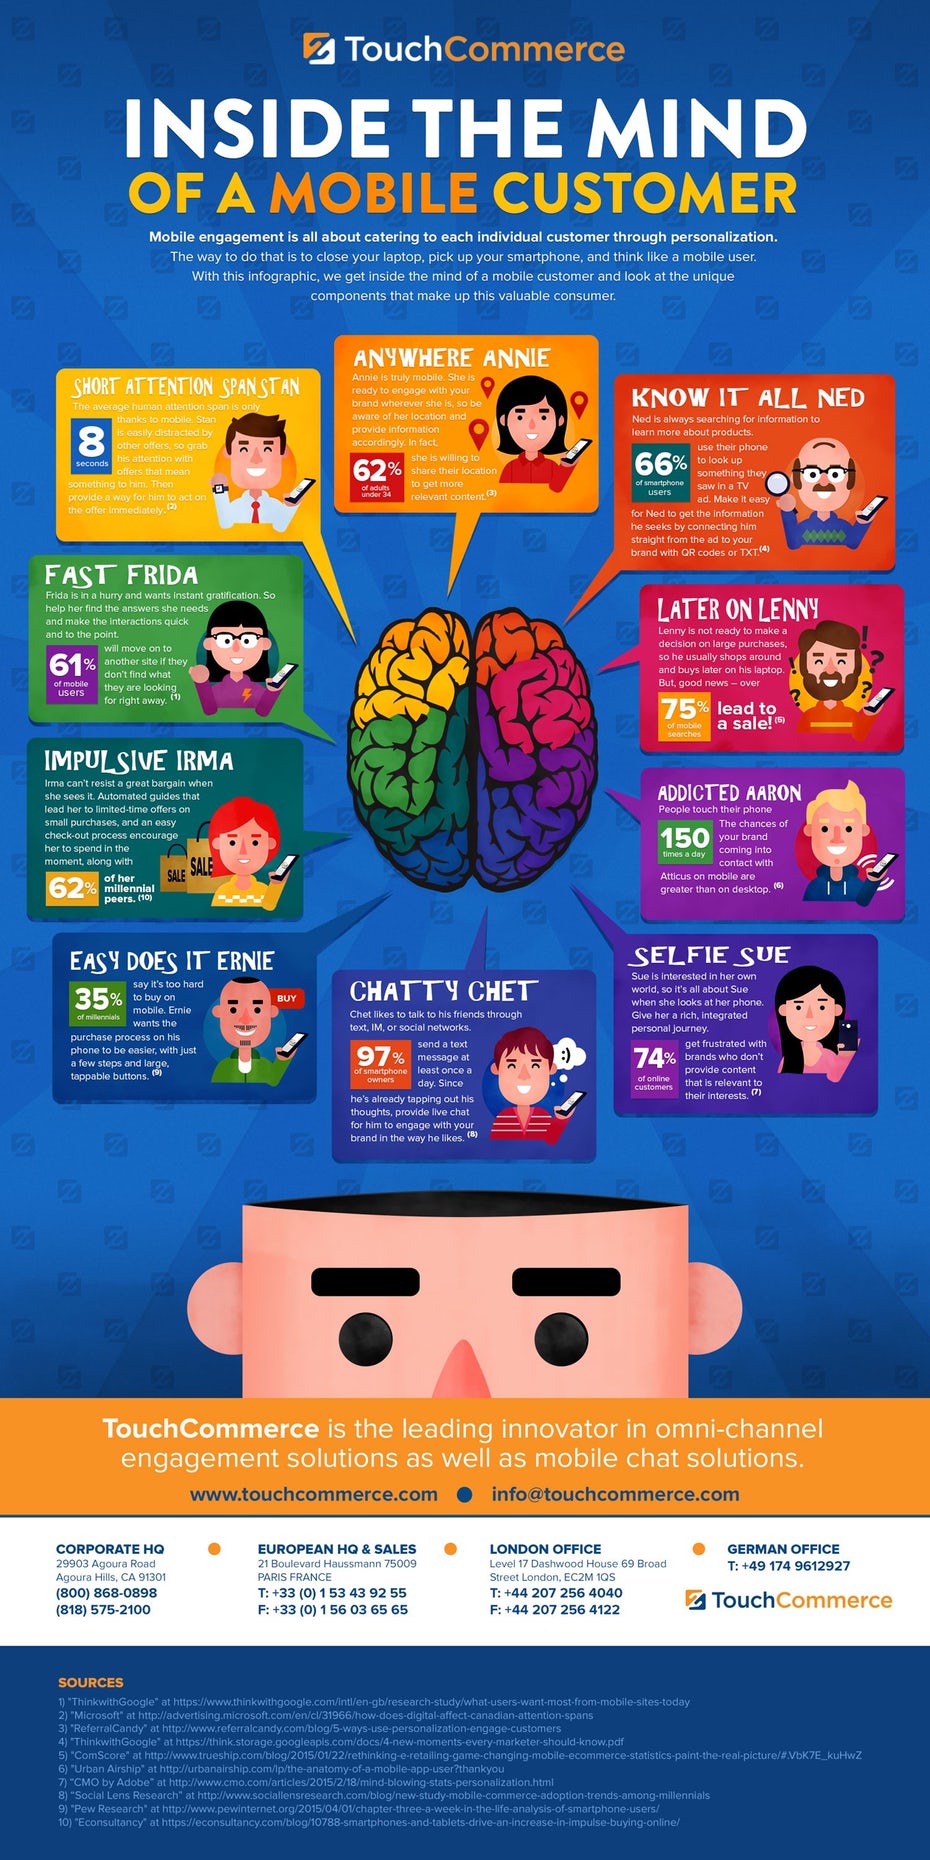
Lists
Whether it’s a Top 10 list like this example or something else, infographic lists are popular and shareable, not to mention a great way to generate traffic.

Roll out new product or showcase brand
Your infographic can be a unique way to introduce something new to your target audience. In this example, augmented reality is depicted using graphics and text imposed over photographic images. The overall effect suggests AR and leaves a distinct impression about the concept.

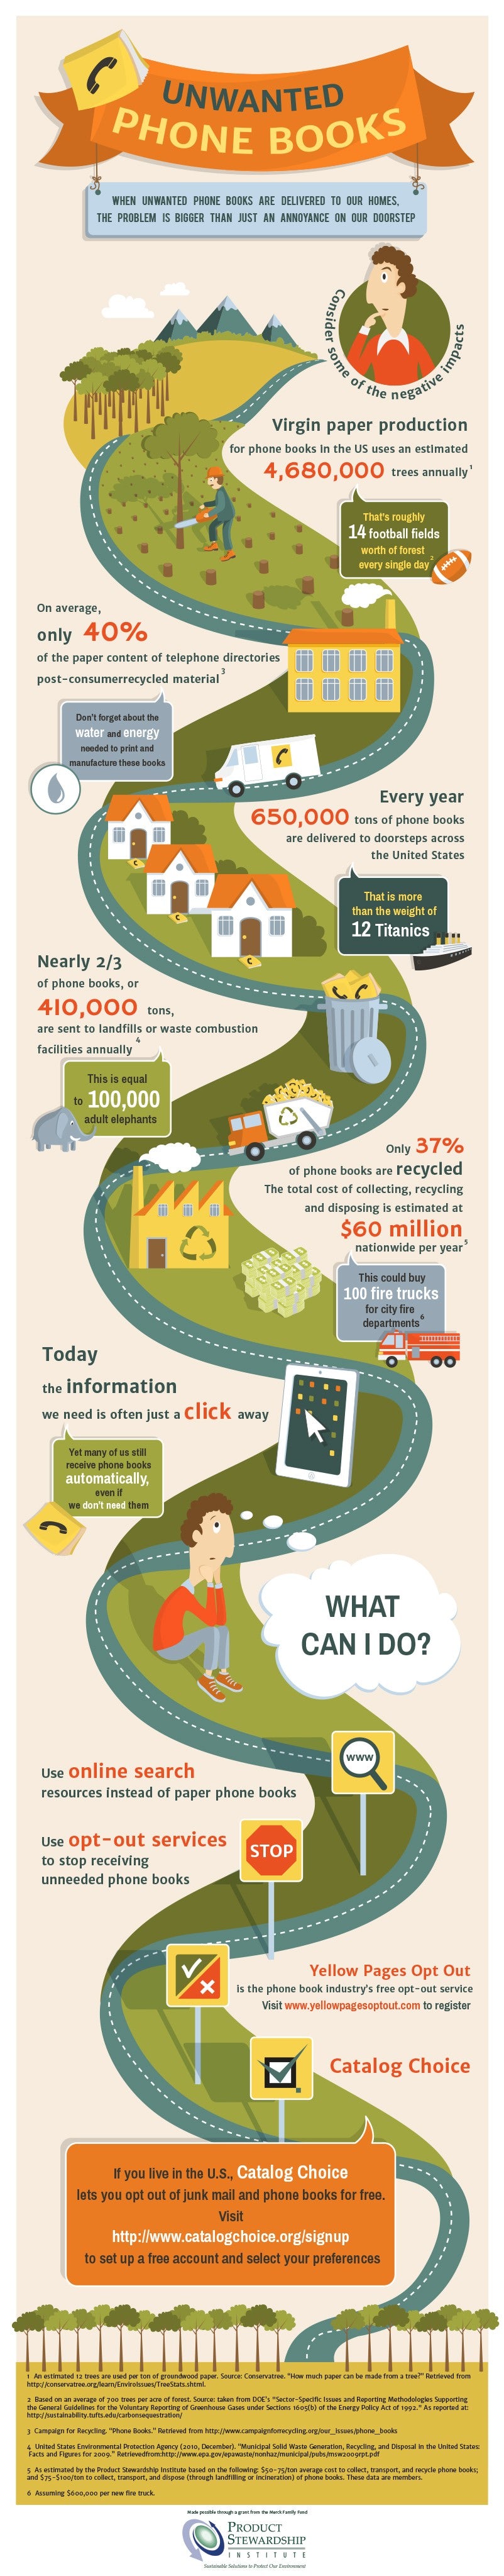
Call to action
An infographic can illustrate a problem and ask viewers to take action, just like a blog post—but far more effectively and more memorably. In the case of this example, the infographic highlights a community problem and offers solutions, hoping to incite action on the part of the reader.
Tips for creating a successful infographic
—
Now that you’re feeling inspired and motivated to create your own infographic, here are some of our best tips for creating a successful infographic.
Know your audience
Target the infographic based on who you want to interest, just as you’d write a blog post for a specific reader. This means choosing not just words, but also images, graphics, and colors that speak to your intended audience.
Choose great topics
What kind of infographic are you hoping to create? A “how-to”? A diagram showing how a product works? A breakdown of your niche industry? Compare your ideas about form to topics that are trending in your area to generate a list of strong infographic topics. In some cases you might also want to visualize some of your existing content.
Inform
Research your topic carefully. Using fewer words shouldn’t mean offering less information. In fact, your infographic should offer more value if possible, and it should be better than anything else that’s out there, in any format. Look for statistics, and occasionally powerful quotes.
Distill
Now that you’ve got lots of great information, distill it down into bullet points. Remember, you’re making your points visually, so each bullet must eventually be depicted. Anything you can depict in place of text, you should.
Flow and shape
Avoid random lists of facts; these don’t make for a great infographic most of the time. Instead, your points should flow together well and tell a story—mostly with graphics and images. Make sure that this kind of clear progression is present.
Get visual and design
Now it’s time to make it all visual. If you’re working with a designer, this part is a cinch; just give them the information, tell them what your goals are, and run with it.
If you’re trying to DIY, take it step by step. First, sketch out the information as a wireframe to verify that your narrative functions well visually. Next, make sure your infographic is the right size and shape. Most infographics are 800 to 1000 pixels wide, and as long as they need to be to get all of their information in. You expand vertically so that it’s easier to scroll and read the infographic and it stays shareable.
Next choose style elements like colors, font, and graphics with consistency in mind. The color scheme should fit the infographic’s topic as well as your brand. If you’re writing about cancer deaths, avoid a fluorescent color scheme; if you’re trying to sell baby clothes with your infographic, stay away from a black and red look.
Avoid using more than two or three fonts throughout the infographic; anything more looks sloppy. It’s fine to use something other than whichever fonts spell out your logo or company name. Your aim should be a consistent, on-theme infographic, not an echo of your brand’s logo or publicity materials.

Finally, proof your work. Make sure that any text that can possibly be visual is portrayed with images or graphics. Cite sources if you’re providing statistics or other information.
Wrapping it up
—
There’s more than one way to create a fantastic infographic for your small business. You can use online tools like Canva, Easel.ly, Venngage, or Piktochart to create one yourself if you feel confident enough in your ability to design. Or, like more than half of all marketers producing visual content in 2017, you can work with a designer.
Creating engaging visual content isn’t easy; doing so consistently was the top struggle reported by marketers in a 2017 survey, followed by the ability to produce well-designed visuals. If you feel you would benefit from using a designer but aren’t sure where to start with a freelancer, you always have the option to run an infographic design contest and have our designer community create something special for you.
Original article written by Karla Lant >
[wpseo_map width=”100%” height=”300″ zoom=”-1″ map_style=”roadmap” scrollable=”0″ draggable=”1″ show_route=”0″ show_state=”1″ show_url=”0″] [wpseo_address hide_address=”1″ show_state=”1″ show_country=”1″ show_phone=”1″ show_phone_2=”0″ show_fax=”0″ show_email=”1″ show_url=”1″ show_logo=”0″ show_opening_hours=”1″]Related Articles